Compare the pair
we put Howard and Costello's record against that of Albanese and Chalmers. by david hughes.
First published in the MRC’s Watercooler newsletter. Sign up to our mailing list to receive Watercooler directly in your inbox.
Last month, the Treasurer released the final budget figures for the previous year. They showed his Government collected tax worth 24.1% of GDP, the highest share since the mid-2000s, and still ran a $22 billion deficit. Asked whether that was acceptable, Jim Chalmers answered with the confidence of a man who had been handed a number and never thought to check it. Tax, he said, is "still lower than what we saw under Howard and Costello".
He quoted the comparison the way a man quotes his best round of golf: accurately, and without mentioning all the others. If he wants a proper comparison, let's have it.
We have put the two records side by side, Howard and Costello's nearly 12 years against Albanese and Chalmers' four, using the ABS, Treasury, OECD and the Budget papers. Here are the highlights.
The number the Treasurer picked
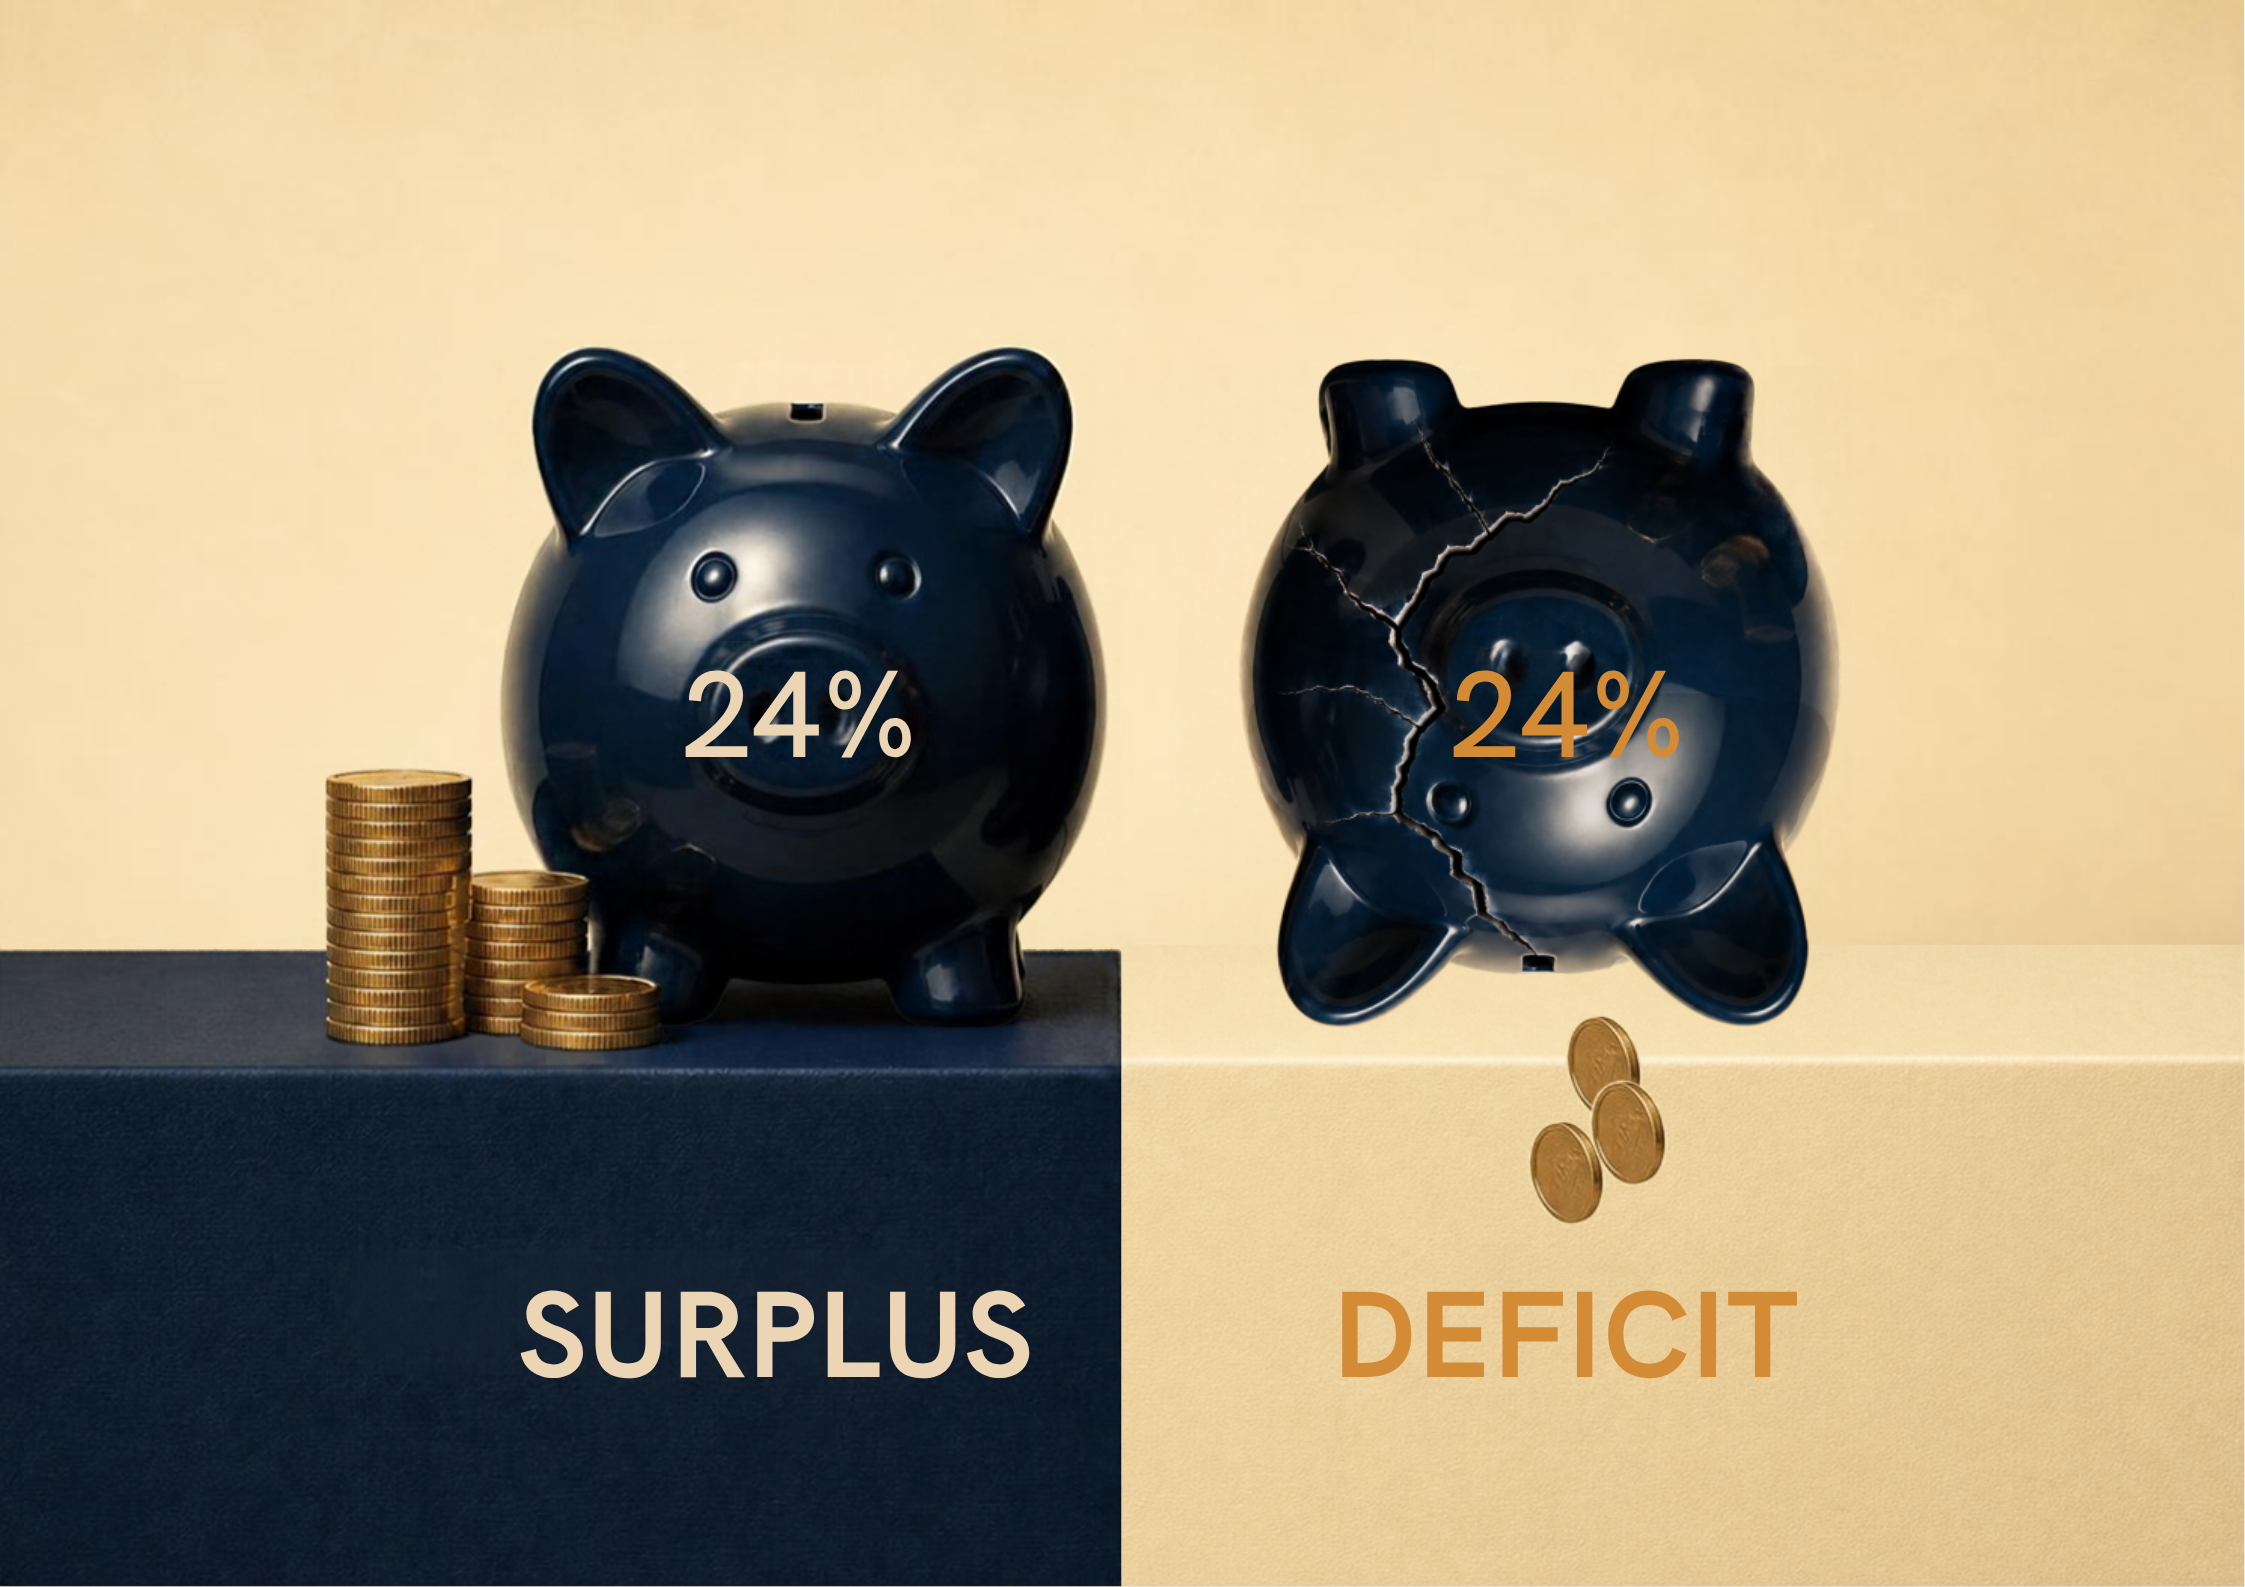
Tax peaked at 24.2% of the economy under Costello, in 2004-05 and again in 2005-06. But look at what came with it. In both years the Budget was in surplus. By 2006 the $96 billion of debt Labor left behind had been paid off, and the surpluses were going into the Future Fund. Costello cut income tax in five Budgets in a row, from 2003 to 2007, handing the gains of a growing economy back to the workers.
Chalmers now collects as much and still cannot balance the books, because Commonwealth spending has reached 26.9% of GDP, the highest outside the pandemic in 40 years. The morning after the latest figures came out, the Reserve Bank lifted interest rates for the fourth time this year, to 4.6%, and pointed to spending as the reason. Costello's 24% came with a surplus, no debt and a tax cut every year. Chalmers' comes with a deficit, more debt, a rate rise and the prospect of even higher taxes down the track.
Living standards
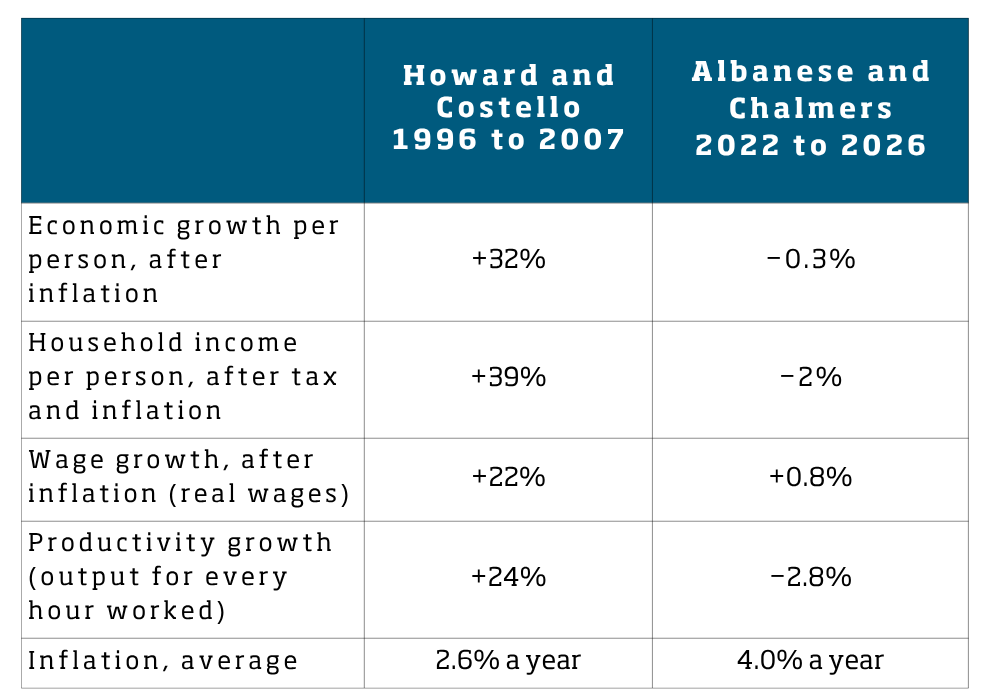
Under Howard and Costello the economy grew by a third for every Australian. Household income per person rose 39%. Real wages, meaning what a pay packet actually buys once rising prices are taken into account, grew 22%. Productivity, the amount produced for every hour worked and the prerequisite of every lasting pay rise, grew 24%.
Under Albanese and Chalmers, the economy has gone backwards for every Australian. Output per person fell in 10 of the last 16 quarters, including seven in a row, the longest run on record. The economy only grew at all because the population rose through record migration. Households have about 2% less to spend per person, after tax and inflation, than when the Government took office. At the low point in late 2023 they had 6% less.
Real wages have grown 0.8% in four years, which is to say the average pay packet buys almost exactly what it did in 2022. On the OECD's measure it buys less than it did. Across the developed world, real wages rose 4% over the same period. Australia ranked 31st of 34 countries. Productivity is 5% below its 2022 peak: Australians are producing less for every hour they work than they were four years ago.
Prices rose 2.6% a year under Howard and 4% a year under Albanese. Electricity took nearly 12 years to rise 42% under Howard. It has risen 37% in four years under Albanese, including 22% in the past year alone as the rebates ran out.
Who pays
The Treasurer insists workers are not carrying the extra load. The extra revenue, he says, comes "overwhelmingly from higher super and investor income". His Budget papers say otherwise.
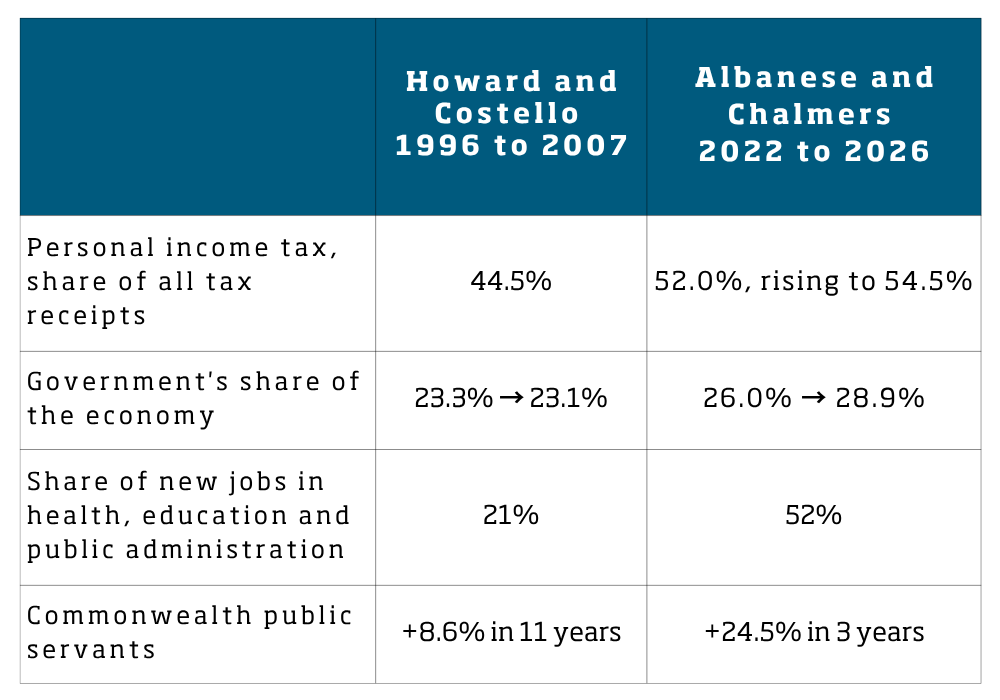
In Howard's final year, 44.5 cents of every tax dollar the Commonwealth collected came from personal income tax. Today it is 52 cents! Based on the Government’s own estimates, it will be 54.5 cents by 2030. This is driven by bracket creep. A worker gets a pay rise that doesn’t keep up with prices, pays a higher rate of tax on it anyway, and the Treasurer pockets a tax rise he never had to announce.
All this extra money pays for a bigger government. Spending and investment by all levels of government held steady at around 23% of the economy through the Howard years. Under Albanese it has climbed from 26% to nearly 29%. More than half of all the jobs created since 2022 have been in health, education and public administration, the parts of the economy largely paid for by taxpayers. Under Howard, it was a fifth. The Commonwealth public service grew 8.6% in 11 years under Howard. It has grown 24.5% in three years under Albanese.
Skills and welfare
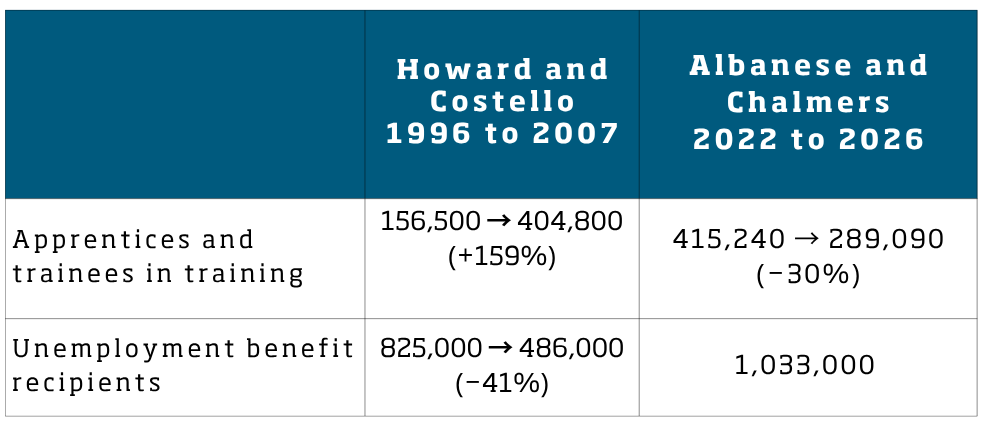
The Howard Government more than doubled the number of Australians in an apprenticeship or traineeship, from 156,500 to 404,800. Under Albanese the number has fallen 30%, to 289,090. This from a Government that has promised to build 1.2 million homes and will need tradespeople to do it. Howard cut the number of Australians on unemployment benefits by 41%, from 825,000 to 486,000. Today about 870,000 Australians are on the same payments, and on the Department's broader count it passed one million in August. On these numbers, Labor can no longer call itself the workers' party. Labor in 2026 is the party of bigger government, fewer tradesmen and higher taxes for workers.
Careful what you wish for
Chalmers is right about one thing. Howard and Costello are the benchmark, defined not by how much they taxed but by what they did with the money. They paid off debt, kept spending in check, lifted living standards and handed the surplus back as tax cuts. Their tax take was the dividend of a growing economy. His is the bill for a growing government.